Fault Type:
Stress Conditions:
Fault types:
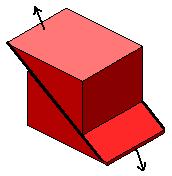
1) Normal faults (called detatchment faults if at a near horizontal angle)
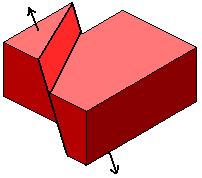
2) Reverse faults (called thrust faults if at a near horizontal angle)
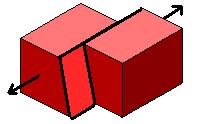
3) Strike-slip faults
17) Without goint back to the first content page, match up each of these three fault types to the following images and give the stress conditions (shear, tension, compression) that would have to exists for each of the fault types.
| Fault Block Diagram | |
|
|
|
Fault Type:
|
______________________ | ______________________ | ______________________ |
|
Stress Conditions:
|
______________________ | ______________________ | ______________________ |
Why is it important to understand of what type a given fault is? Understanding what type of fault is found in a given location tells us what forces are acting on the rocks in that area (or acted in the past if the fault no longer is active). This kind of information can help us answer all sorts of questions, such as what processes are causing the motion of crustal plates (continental drift).
The purpose of what follows on the rest of this content page is more to show you what sort of information geologists can obtain, rather than to have you understand it in detail. I include it because I think that it is so impressive to see just how much information we can gather about what happens deep within the Earth.
When faults extend to the surface of the earth, we can use the techniques to determine fault surface orientation and relative motion that are similar to what we used to determine the orientation of rock layers, although the process is a bit more complicated. With different possibilities for both the orientation of the fault surface and direction of motion on the fault, working out the fault type becomes more complicated.
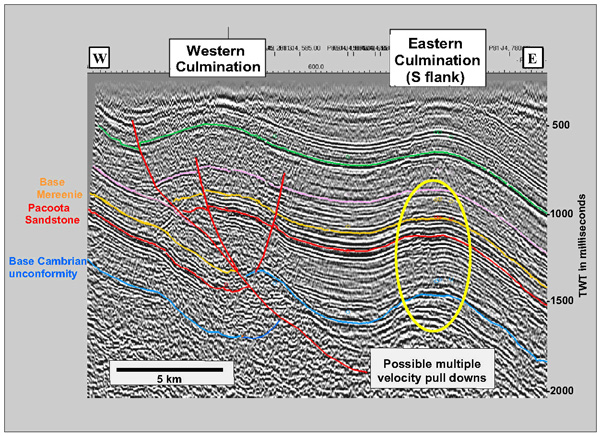
When faults do not intersect the surface, they can still be visualized by seismic imaging or ground penetrating radar, if they are not too deep.
Seismic surveys involve the use of a thumper truck. This vehicle parks itself in the area of interest. A number of geophones (microphones that are implanted in the earth) are set up around the truck, often over distances of many kilometres. The truck then produces a seismic signal, either by setting off small explosions or by using a hammer-like device that hits the earth under the truck. The siesmic waves from this activity propegate through the earth, bounce off different features within the earth, and make their way back up to the geophones where they are recorded. The time delay at each geophone allows the depth of each feature to be calculated. Usually, the signals from each geophone are integrated to produce an image of the features under the ground.
|
A typical seismic image looks something like this. Take note of the scale at the bottom. Most of the other text that has been added to the image is not important to us. What is interesting is that the depth scale along the right-hand side is in milliseconds, rather than metres or kilometres. Identifiable features have been colour coded by an expert seismologist. In order to know what line on the image represents a given rock layer, the experts must have access to information from drill holes or from sites where these rocks are exposed at the surface.
In the middle-left of the image are three faults outlined in red. 19) Can you see any evidence of folding near this fault? |
 |
|
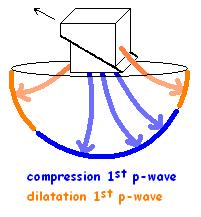
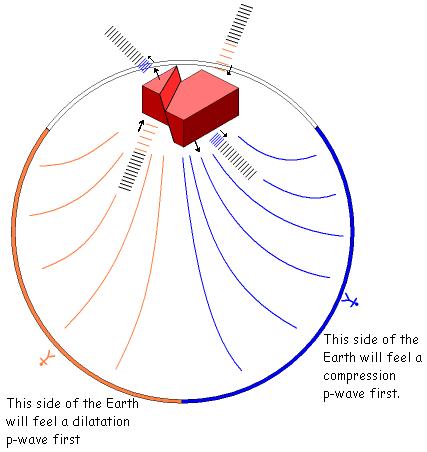
Many faults, especially the ones that are significant to understanding plate tectonics, are too deep (tens to hundreds of kilometres) or in locations that are too remote for seismic surveying. Fortunately, the earthquakes that occur on these faults provide the means to understand how the rocks on either side of the fault are moving. The seismic waves generated by an earthquake contain information that can be decoded and used to determine the nature of the fault on which the earthquake occurres. The critical information is containted in the p-waves. These are the first seismic waves to arrive from an earthquake. When a p-wave is generated, the first direction of the particles at the site of the earthquake is the same as the first direction the motion when the p-wave arrives at some remote location at the surface of the Earth. Consider the diagagram to the right. Two masses of rock on either side of a fault surface (a crack in the rock) suddenly move. One block moves downward, the other upward. Each pushes on the earth in one direction and pulls at it in the other direction. In the pushing direction, the rock molecules are pushed closer together (they are compressed). These push together the particles in front of them and so on. The compression wave travels through the earth just like the slinky experiment that I asked you to perform. When the wave finally reaches the surface, the first thing that is felt there is a compression pushing upwards. In the opposite direction, this block or rock pulls at the rock around it and creates a dilatation in the rock particles which causes a pull downwards when that p-wave finally reaches the surface. The rock on the other side of the fault does the same thing, but in the opposite directions. What seismologists do is to collect the direction of first motion for a given earthquake event from seismograph stations all over the world and plot this information onto a circle that represents the surface of a half sphere. The data from seismic stations on the opposite side of the earth are usually the ones that are plotted. The centre of the circle represents the place on the surface of the Earth exactly opposite from where the earthquake occurred.
Areas experiencing a compression first motion are plotted in black (blue in the diagram above). Areas in white (orange in the diagram above) experience a dilatation first motion. What we get is something that looks rather like a beach ball. The beach ball diagrams are helpful because the distribution of black and white patches is different for the different types of faults. |
 |
| Normal Fault | Reverse Fault | Strike-slip Fault |
Oblique Fault |
 |
 |
 |
 |
The interpretation of these beach balls is more complicated than I have represented here, but you should get the idea that the way in which compressive and dilatational first p-waves are distributed across the Earth's surface can tell us what type of fault was responsible for the earthquake. This, in turn, allows us to identify the nature of stress involved in creating the earthquake. This will be very handy when we try to figure out just what forces are at work to create the motion of tectonic plates.