Shallow Seismic Imaging
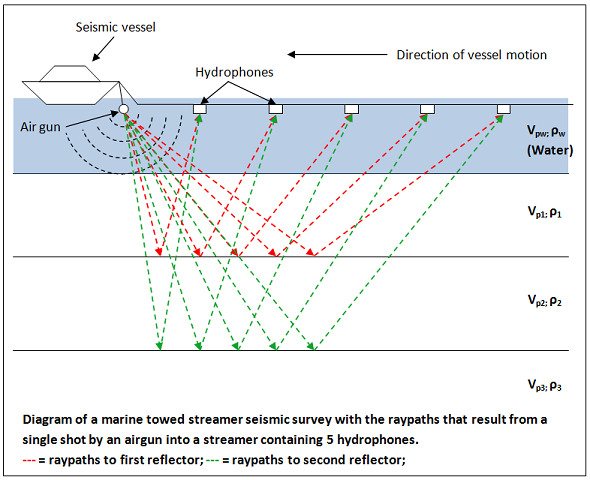
On of the questions that geologists might have is what rock layers exist under ground where the ground is fairly featureless and no rocks are exposed. One could dig a large trench, but this is seldom practical. A similar situation is faced when investigating rock layers underwater. The solution is to use seismic waves. A small explosion or (or impact if on land) is set off and the time taken for the seismic wave to travel to a string of microphones (geophones) is measured.
What we want to know about a rock layer is its thickness (h) and its speed of sound (v) since that reflects its chemical composition.
The analysis makes use of the speed equation: v = d/t and the Pythagorean theorem relating the side lengths of a right triangle: a2 + b2 = c2
Consider the diagram below.
A seismic wave can travel in a straight line towards the geophone, and this wave will arrive first as it has the shortest path (X).
Seismic waves can also reflect off the bottom of the shallowest rock layer under the explosion, and this wave will arrive second, since it is following a longer path (d) at the same speed.
What we can measure is (X) for each microphone and (t), the time taken for the reflective wave to reach the microphone.
The time it takes for the seismic wave to reach the geophone is t = d/v where v is the speed of the wave.
This can be rearranged to give d = vt.
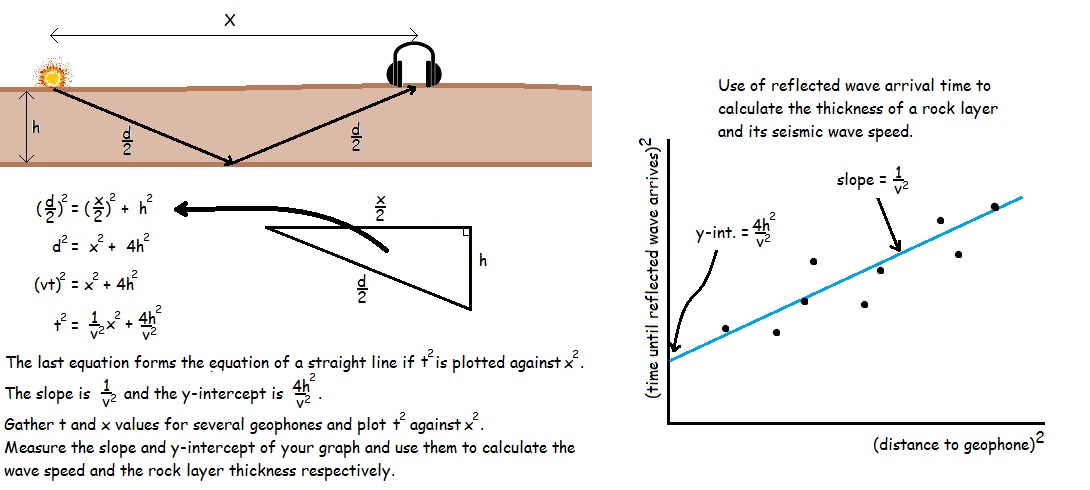
You will notice that d/2, h, and X/2 form a right triangle.
Thus, h2 + (X/2)2 = (d/2)2
Multiply through by 4 (22 and we get:
4h2 + X2 = d2
Since d = vt
4h2 + X2 = (vt)2
Divide through by v2 to get:
(4h2/v2) + (1/v2)X2 = t2
It may not look it at first, but this is an equation for a straight line where t2 is y and X2 is x.
Both t and X are things we can measure.
So if we plot t2 vs X2 for a bunch of geophones, we should get a straight line.
The slope of this line is 1/v2 and the y intercept is 4h2/v2.
If we measure the slope off the graph, then v = (1/slope)0.5
If we measure the y-int off the graph, then h = ((y-int)v2/4)0.5
One could simply measure the time taken for the wave to go straight down, bounce off the base of the rock layer, then travel back up to a geophone at the site of the explosion, and calculate the thickness (h) of the rock layer as vt. However, the speed of the seismic waves usually also is one of the unknowns, at least not known precisely enough. Instead, the wave speed and thickness of the rock layer can be calculated from a set of geophones away from the explosion as shown in the diagram.
Reflection Seismology
This procedure works with multiple rock layers as well, the math just gets more complicated.
The arrival times of each successive reflection at each geophone can produce a thickness, speed, and depth for all the different rock layers as well as features such as faults. The analysis is more complicated as each reflected sound pulse has to pass through all the layers above it, each with a different speed of sound. Add in the fact that sound pulses can bounce back and forth between two boundaries multiple times and it is obvious that this sort of analysis can only be accomplished using sophisticated computer algorithms. It is such a computationally intense process that a recent paper suggested that about one third of all the total global computer processor time is spent on seismic reflection analysis.
What the analysis provides is a detailed summary of the rock layers present under the earth.
In the diagram below, each squiggly vertical line represents the sound wave heard by one of the individual microphones. The Y axis would originally have been the time of arrival of each reflected wave. It usually is reformulated by the analysis to represent a depth
below the surface of the layer that the wave reflected off. The right-hand deflection of each wave is filled in with a dark colour. This makes each reflection stand out visually and allows us to picture each of the layers that are present.
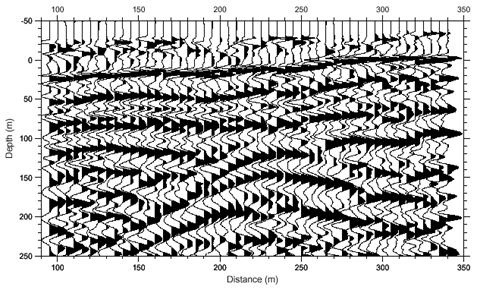
The impression that you should get in the diagram above is that of a mound-shaped structure at the bottom centre with horizontal layers butting up against it on both sides and across the top.
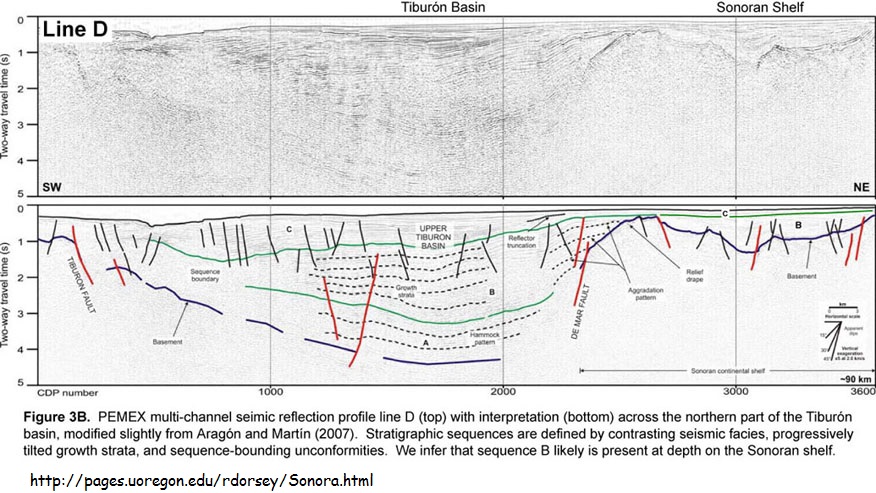
The following is a reflection profile image of a much larger area with followed by an interpretation by a trained geophysicist of what geologic formations are depicted in the raw image.